Fortum in brief
Fortum is a Nordic energy company. We generate and deliver reliable energy to our customers and the Nordic energy system while at the same time helping industries decarbonise their processes and grow. Our core operations comprise of efficient and best-in-class low-carbon power generation, customer services, and heating and cooling. Fortum’s power generation is already 99% from renewable or nuclear sources with one the lowest specific CO2-emissions in Europe. We are guided by our ambitious SBTi-validated emission reduction targets on our way towards net-zero by 2040. For our ~4,500 employees, we commit to be a safe and inspiring workplace. Fortum's share is listed on Nasdaq Helsinki.
| Fortum | 08/05/2025 | ||
|---|---|---|---|
| Currency | EUR | Volume | 1,220,819 |
| Previous Close | 14.67 | Number of shares (million) | 897.26 |
| Change (%) | 0.07 | Market Cap (million) | 13,158.38 |
Strategy
Fortum’s purpose and strategy is clear. We want to power a world where people, businesses and nature thrive together.
Through our strategic priorities – Deliver reliable clean energy, Drive decarbonisation in industries and Transform and develop – we are in a key role in by enabling and accelerating electrification in the Nordics— and for this future we need new values, supporting us in the strategy execution.
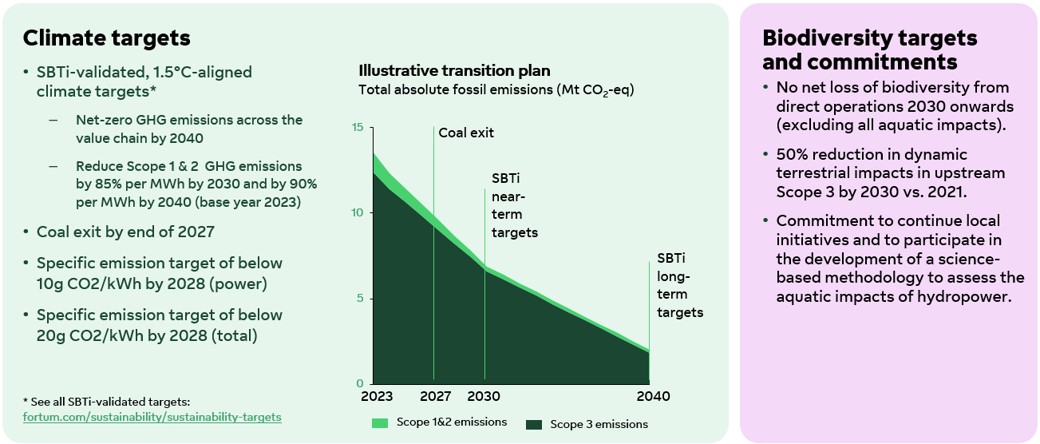
Fortum’s climate and biodiversity targets
Key figures, continuing operations
| EUR million or as indicated | 2024 | 2023 | 2022 | 2021 | 2020 | 2019 |
|---|---|---|---|---|---|---|
| Sales | 5,800 | 6,711 | 7,774 | 6,422 | 49,015 | 5,447 |
| Comparable EBITDA | 1,556 | 1,903 | 2,025 | 2,016 | 2,434 | 1,766 |
| Comparable operating profit | 1,178 | 1,544 | 1,611 | 1,429 | 1,344 | 1,191 |
| Operating profit | 1,325 | 1,662 | 1,967 | 4,325 | 1,599 | 1,118 |
| Comparable share of profit/loss of associates and joint ventures | -30 | 7 | -40 | 104 | 656 | n/a |
| Profit before income taxes | 1,399 | 1,583 | 1,564 | 4,332 | 2,199 | 1,728 |
| Earnings per share, EUR | 1.30 | 1.68 | 2.34 | 4.49 | n/a | n/a |
| Equity per share, EUR | 10.11 | 9.40 | 8.55 | 13.66 | 14.58 | 14.61 |
| Net cash from operating activities | 1,392 | 1,710 | 1,717 | 1,119 | 2,555 | 1,575 |
| Financial net debt | 367 | 942 | 1,084 | 789 | 7,023 | 4,833 |
| Financial net debt/comparable EBITDA | 0.2 | 0.5 | 0.6 | n/a | n/a | n/a |
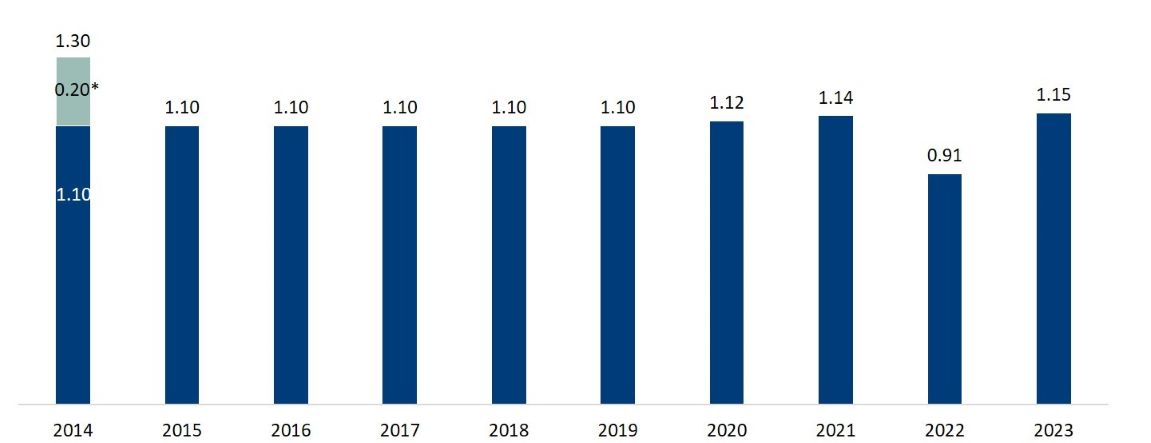
Dividend
Fortum’s dividend policy is based on a payout ratio of 60–90% of comparable EPS reflecting the potential earnings fluctuations of Fortum’s power generation portfolio.
Dividend per share (EUR) history
Dividend per share (EUR) history
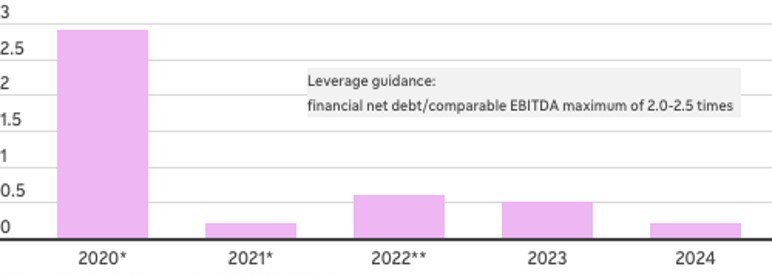
Financial targets
• Stable credit rating of at least BBB
• Leverage guidance: financial net debt/comparable EBITDA of 2.0–2.5 times in the longer term.
Financial net debt/comparable EBITDA development
Financial net debt/comparable EBITDA development
Shares and votes
Shares and votes
Fortum’s power generation in 2024
Total power generation 46.3 TWh
Fortum’s power generation in 2024
Total power generation 46.3 TWh
Fortum’s heat production in 2024
Total heat production 4.1 TWh
Fortum’s heat production in 2024
Total heat production 4.1 TWh
Financial Calendar
Company contacts
Stay updated with our IR App:
