Financial and operational highlights
- As at and for the financial years ended December 31, 2018, 2019 and 2020
- (CAGR 2018-2020)
-
Consolidated financial highlights
Operating income before impairment loss and other expenses
(Operating income before impairment loss and other expenses which also includes share in net results of equity accounted investees)1,949 SAR
mn3.5 ↗ -
Parent-level liquidity and leverage highlights
Parent operating cash flow (POCF)
(Distributions received from subsidiaries and associates / JVs, after non-recourse debt service, plus other cash inflows at parent level and cash generated by sell-downs and / or disposals of the Group’s investments, less parent-level expenses (e.g. G&A costs, taxes))1,064 SAR
mn10.2 ↗
-
Profit/(loss) attributable to equity holders of the parent
(The net profit/(loss) for the year for all operations of the Group including discontinued operations)883 SAR
mn- -
Parent net leverage
(Borrowings with recourse to the parent, plus off-balance sheet guarantees in relation to Equity Bridge Loans (EBLs) and Equity LCs in addition to the equity-related guarantees on behalf of its JVs and subsidiaries, net of free cash and cash equivalents)7,051 SAR
mn195.4 ↗
-
Adjusted profit attributable to equity holders of the parent
(Adjusted profit attributable to equity holders of the parent after adjusting and/or normalizing profit attributable to equity holders of the parent for non-routine and non-operational items)1,264 SAR
mn11.0 ↗ -
Parent net leverage ratio
(Net leverage as a percentage of net tangible equity attributable to equity holders of the Parent)0.97
Times-
-
Health, safety and environment performance
Lost Time Incident Rate (LTIR)1
NOMAC achieved more than 20 million safe man-hours without LTI
Leading LTIR ratio of 0.03 for both under-construction and operational assets As of 2020, significantly below industry benchmarks2 of 0.70 and 0.10 respectively1. Ratio includes both full time employees of ACWA Power and temporary contractors.2. Refers to OSHA benchmark (US utility industry).3. Data on 200,000 man hours. -
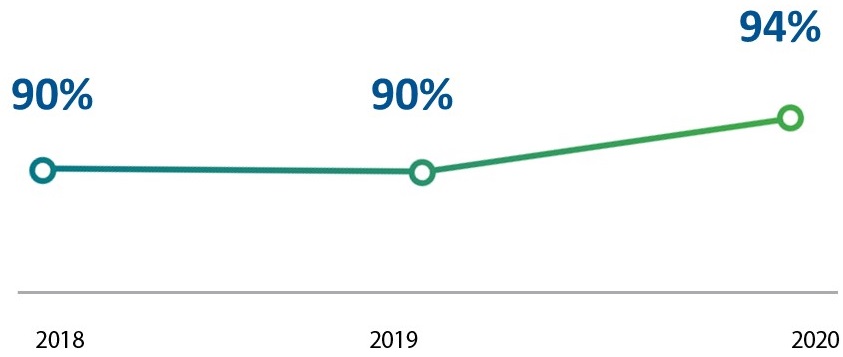
Availability performance

Power availability

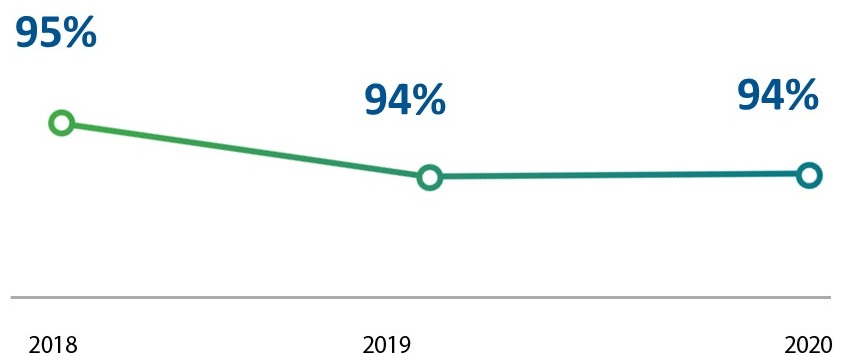
Water availability
 Figures might have been reported only for NOMAC in some other Company reports with immaterial difference to above.
Portfolio highlights
- As at September 30, 2021
-
251.8
SAR Bn
Average age of
portfolio1-
0-5 Years81.5%
- 6-10 Years7.5%
- > 10 Years11.0%
-
0-5 Years
-
Operating mix by project cost
- Operating 39.9%
- Under construction 23.4%
- Advanced development 36.7%
- Operating
-
6.4
mm3/day
Water split by
technology2- MSF4 15.2%
- MED5 12.5%
- SWRO3 72.3%
- MSF4
Project split by geography by project cost
251.8
SAR Bn

Top 5 Countries represents 90 percent of total estimated project cost
-
 Saudi Arabia 58.3%
 UAE 15.1%
 Uzbekistan 6.8%
 Oman 5.5%
 Morocco 4.7%
 Egypt 2.2%
 South Africa 2.0%
 Bahrain 1.6%
 -
 Jordan 1.6%
 Turkey 1.4%
 Azerbaijan 0.4%
 Ethiopia 0.3%
 Vietnam 0.1%
Power split by technology (gross capacity) - Detailed
42.7
GW
-
Natural Gas 42.7% Oil 17.0% Coal 5.6% PV 12.8% Wind 9.3%
-
CSP parabolic 2.4% CSP tower 0.8%
 Green Hydrogen (includes solar and wind) 9.4%


- 1 Total project costs for operating, under construction, and advanced development assets.
- 2 Including under construction and advanced development projects as of September 2021.
De-risked business model


Contracted and resilient cashflows protected against a multitude of risks1
- Long-term take-or-pay P(W)PAs protect against demand or price risk.
- P(W)PAs contractually protected against potential changes in regulation.
- Offtake agreements with weighted avg. remaining life of ~22 years.
100%
- Hard currency indexed contracts with embedded inflation protection.
- Contracted assets financed in respective tariff currencies.
93%
- P(W)PA with predominantly investment grade and/or sovereign-linked off-takers.
- Overall off-taker risk mitigated given the critical nature of the assets.
- Sovereign guarantees.
76%
- Gas, oil, coal: Typical fuel pass-through mechanisms for contracted thermal assets and/or off-takers supplying their own fuel.
- Renewables: Extensive and bankable resources studies; CSP technology with storage offers around the clock baseload power.
100%