| Market: Tadawul | Symbol: 4002 | ISIN: SA12C051UH11 | Industry: Health Care Equipment & Svc |
MOUWASAT MEDICAL SERVICES WAS FOUNDED IN 1975
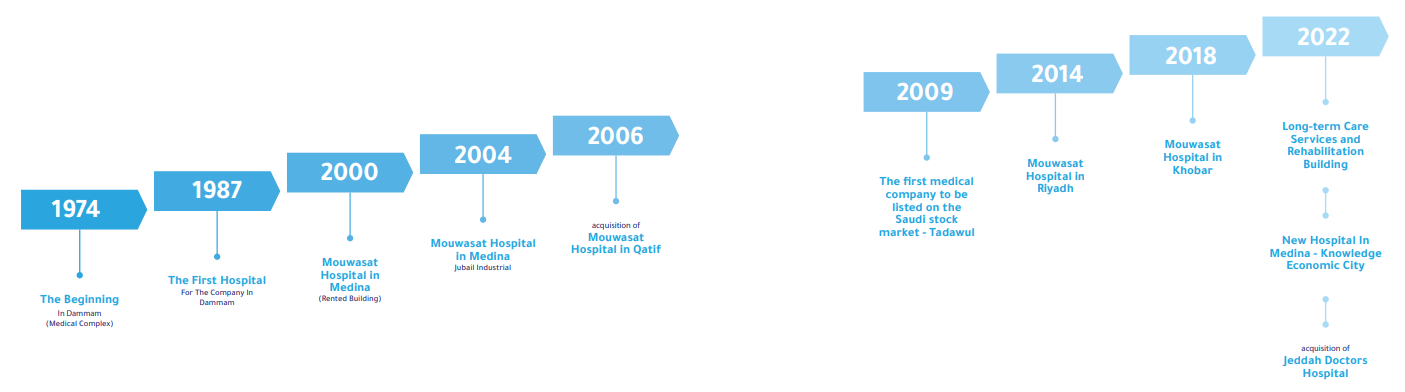
It started as a sole proprietorship with a capital of 100,000 Saudi riyals owned by Mr. Muhammad Sultan Al-Subaie for the purpose of managing and operating medical facilities by establishing the Al-Mouwasat Clinic in the year 1975 AD, and hence the first comprehensive medical facility was established under the name Al-Mouwasat Hospital in Dammam in the year 1984 AD. Which started working in 1988.
The Mouwasat Story
The company's main activity is based on providing medical services to patients through a network of hospitals that it owns %100 or has majority stakes in and rented medical facilities, as well as selling medicines through its pharmacies. The following is a summary of this medical network;
Hospitals |
Opening Dates |
Region |
Infrustructures |
Ownership |
|
| Mouwasat Hospital Dammam | 1987 |
Eastern |
200 Beds |
80 Clinics |
100% |
| Mouwasat Hospital Jubail Industrial | 2004 |
Eastern |
200 Beds |
80 Clinics |
100% |
| Mouwasat Hospital Qatif | 2006 |
Eastern |
120 Beds |
35 Clinics |
51% |
| Mouwasat Hospital Riyadh | 2014 |
Central |
200 Beds |
100 Clinics |
100% |
| Mouwasat Hospital Khobar | 2018 |
Eastern |
260 Beds |
100 Clinics |
100% |
| Mouwasat Hospitals Al Madinah Almunawrah | 2022 |
Western |
220 Beds |
80 Clinics |
100% |
| Mouwasat Hospital Yanbu Industrial City | Western |
200 Beds |
60 ICUs |
100% |
|
| Mouwasat Hospital Jeddah | Western |
300 Beds |
70 ICUs |
51% |
|
New Mouwasat Hospital Riyadh Al-Qasadiyah |
Central |
120 Beds |
35 ICUs |
100% |
|
| Share data | 17/04/2025 |
| Currency | SAR |
| Previous Close | 73.50 |
| Change (%) | 0.00 |
| Volume | 247,876 |
| Number of Shares (mln) | 200.00 |
| Market Cap (mln) | 14,700.00 |
| Financial Highlights, SAR Million | 2022 | 2023 | 2024 |
| Consolidated Income Statement | |||
| Revenue | 2,014 | 2,313 | 2,428 |
| Gross profit | 1,102 | 1,313 | 1,289 |
| Operating profit | 673 | 757 | 724 |
| Profit before zakat | 660 | 727 | 706 |
| Profit for the year | 633 | 688 | 670 |
| Profit for the year attributable to shareholders of the company | 599 | 658 | 646 |
| Consolidated Balance Sheet | |||
| Total assets | 4,662 | 4,965 | 5,403 |
| Total liabilities | 1,585 | 1,538 | 1,689 |
| Total equity | 3,076 | 3,427 | 3,714 |
| Consolidated Cash Flow | |||
| Net cash from operating activities | 707 | 814 | 1,256 |
| Net cash used in investing activities | (473) | (475) | (468) |
| Net cash outflow from financing activities | (247) | (434) | (411) |
| Cash and cash equivalents end of the year | 144 | 49 | 427 |
| Key Indicators | |||
| Earnings per share (SR) | 3.00 | 3.29 | 3.23 |
| Gross Profit Margin (%) | 54.7 | 56.8 | 53.1 |
| Net Debt to Equity Ratio | 0.52 | 0.45 | 0.45 |
| Current Ratio | 2.1 | 1.9 | 2.0 |