| Market: Qatar | Symbol: QNBK | ISIN: QA0006929895 | Industry: Banks |
About QNB Group:
Qatar National Bank (Q.P.S.C.) (QNB Group) was established in 1964 as the country’s first Qatari-owned commercial bank, with an ownership structure split between the Qatar Investment Authority (50%) and the remaining (50%) available to be held by members of the public.QNB Group has steadily grown to be the biggest bank in Qatar and one of the largest financial institution in the Middle East and Africa region.
| Subsidiaries | Country of incorporation | Year of incorporation / acquisition | Ownership % |
|---|---|---|---|
| QNB International Holdings Limited | Luxembourg | 2004 | 100% |
| QNB Property France | France | 2008 | 100% |
| QNB Capital LLC | Qatar | 2008 | 100% |
| QNB (Suisse) S.A. | Switzerland | 2009 | 100% |
| Qatar National Bank Syria (S.A.E.) | Syria | 2009 | 50.80% |
| QNB Finance Ltd | Cayman Islands | 2010 | 100% |
| PT Bank QNB Indonesia Tbk | Indonesia | 2011 | 91.57% |
| QNB Financial Services WLL | Qatar | 2011 | 100% |
| Mansour Bank for Investment PJSC | Iraq | 2012 | 54.20% |
| Qatar National Bank Tunisia | Tunisia | 2013 | 99.998% |
| Qatar National Bank (S.A.E.) | Egypt | 2013 | 95.00% |
| QNB Bank A.S. | Turkiye | 2016 | 99.88% |
| QNB (Derivatives) Limited | Cayman Islands | 2017 | 100% |
| Digital-Q-FS Limited | United Kingdom | 2022 | 100% |
The Group is one of the largest bank by Market Capitalisation, Total Assets, Loans, Deposits and Profit in Qatar and Middle East and Africa region.
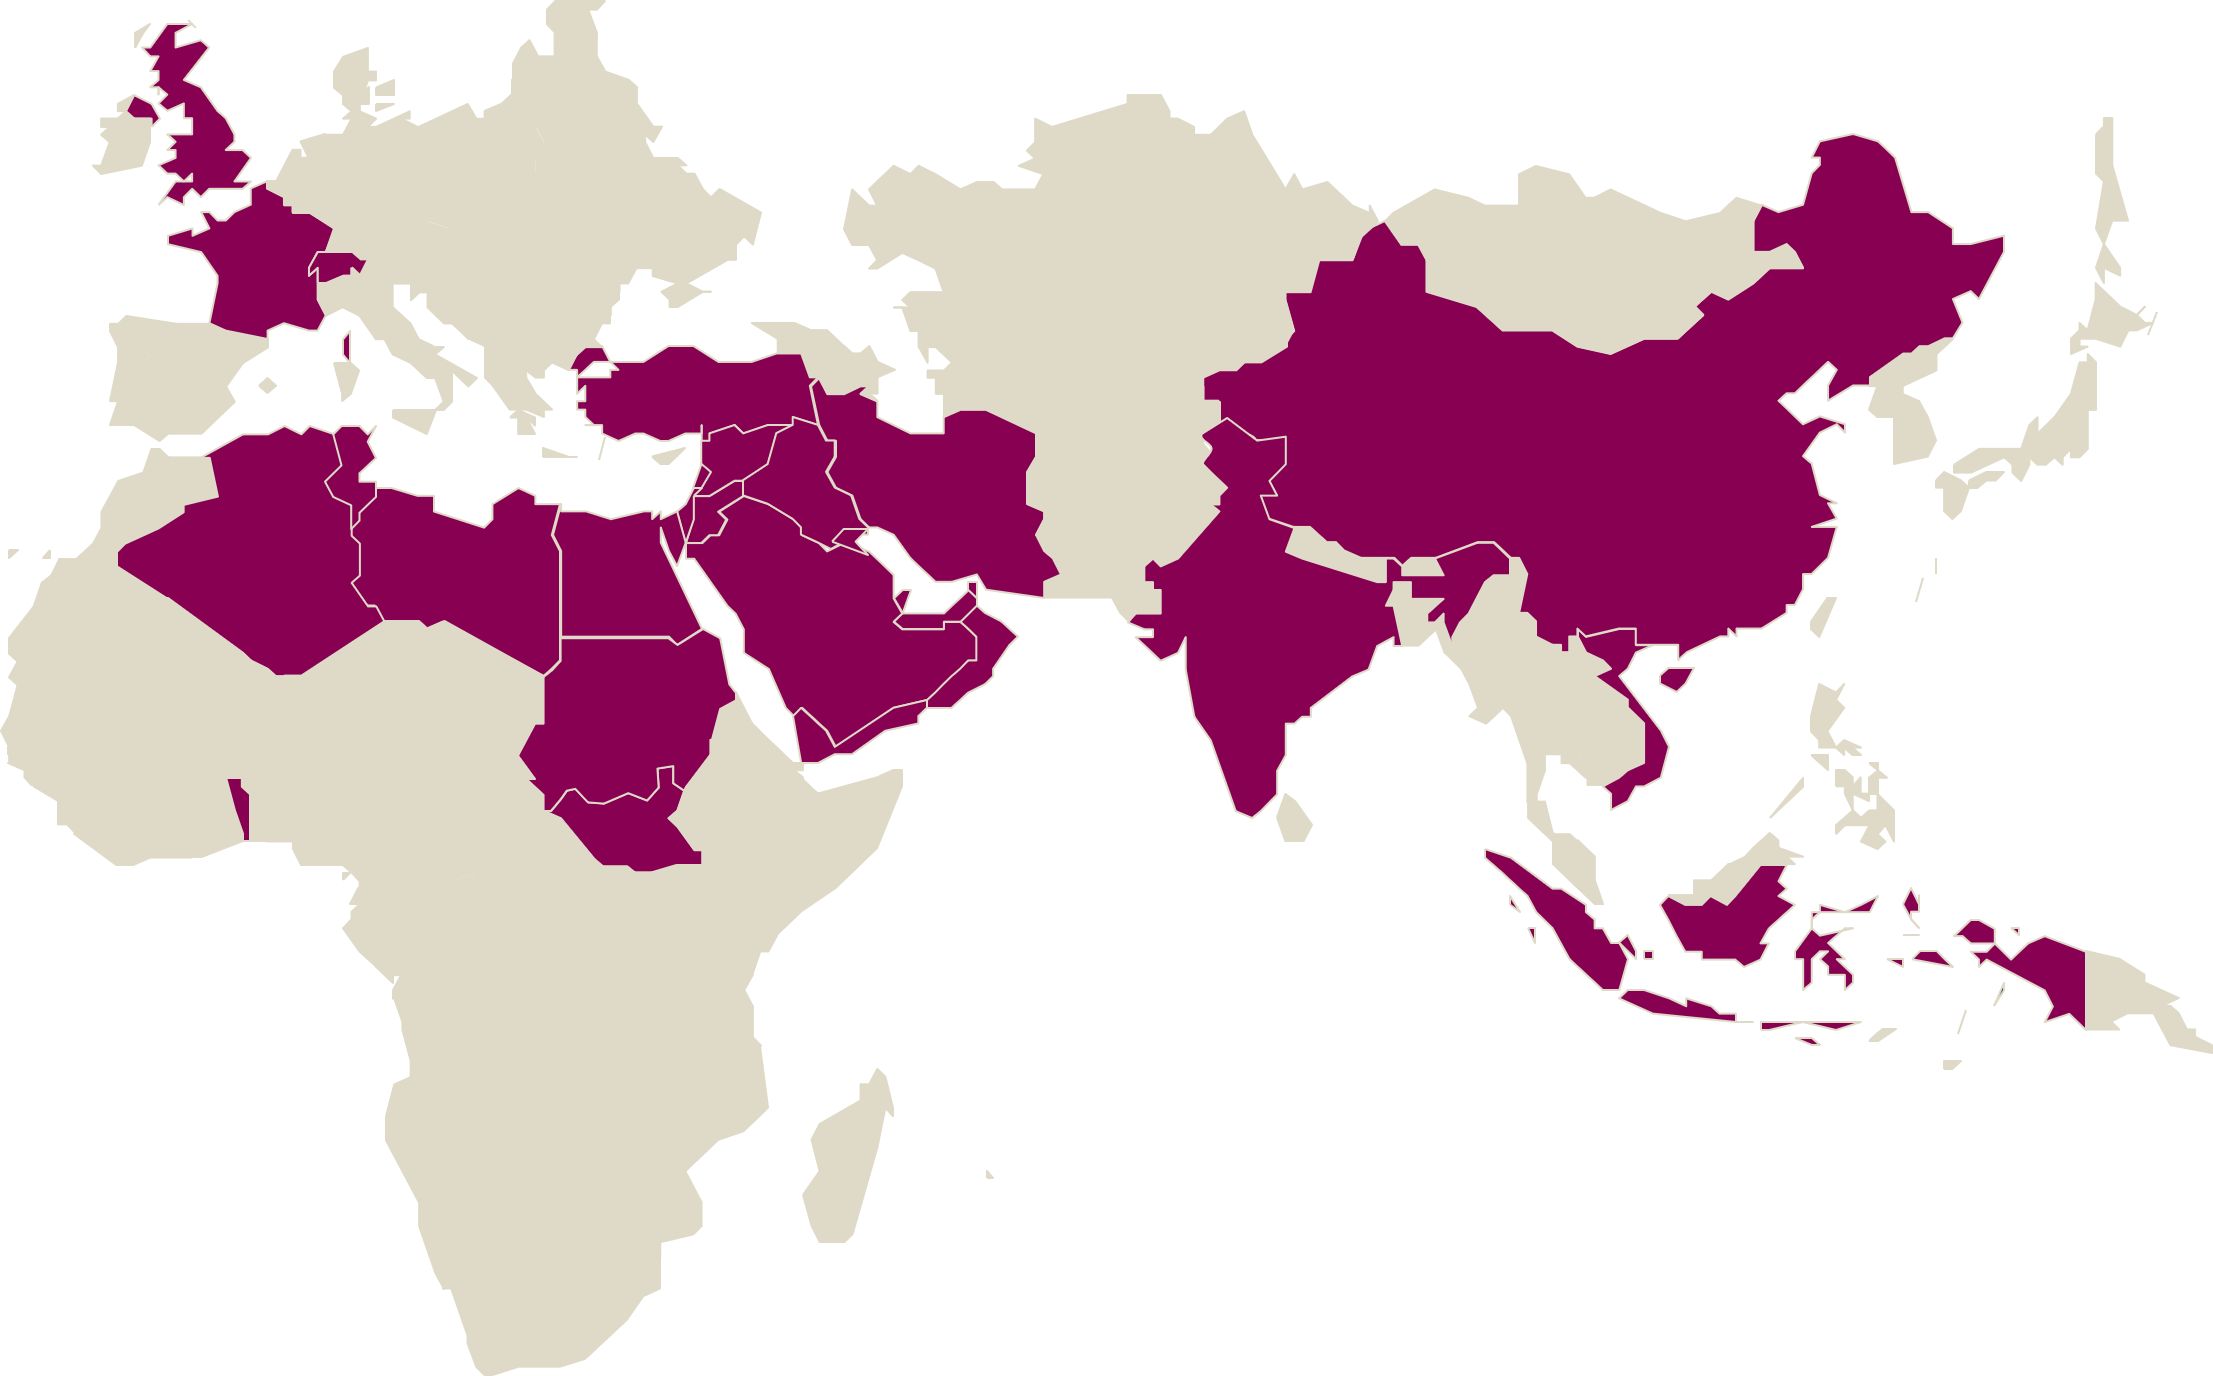
QNB's International Footprint
QNB Group, subsidiaries and associate companies operate in more than 28 countries around the world across 3 continents, through more than 900 locations, supported by more than 5,000 ATMs and employing more than 31,000 staff.
-
Based on the Group’s consistent strong financial performance and its expanding international presence, QNB is currently ranked as the most valuable bank brand in The Middle East and Africa, according to Brand Finance.
-
The Bank has also been the recipient of many awards from leading international specialised financial publications and institutions.
-
QNB Group has an active community support program and sponsors various social, educational and sporting events.
| Share data | 29/05/2025 | ||
| Currency | QAR | Volume | 29,536,089 |
| Previous Close | 16.95 | Number of Shares (mil) | 9,236.43 |
| Change (%) | -0.59 | Market Cap (mil) | 156,557.46 |
| Financial Highlights (USD' billions) | 2024 | 2023 | 2022 |
| Total Assets |
357 | 338 | 327 |
| Loans | 250 | 234 | 222 |
| Deposits | 244 | 235 |
231 |
| Total Equity | 31 | 30 | 29 |
| Profit | 4.7 | 4.3 | 4.0 |
| Operating Income | 11.4 | 10.7 | 9.6 |
| Cost to Income Ratio | 22.3% | 20.0% | 19.7% |
| NPL Ratio | 2.8% | 3.0% | 2.9% |
| Stage 3 Loans Coverage Ratio | 100% | 100% | 99% |
| Loans to Deposits ratio | 96.8% | 94.7% | 95.9% |
| Capital Adequacy ratio | 19.2% | 19.8% | 19.6% |
Last Updated: January 2025
Supplied by ©
