
Factsheet
Market: BIVA
Symbol: FNOVA17
ISIN: MXCFFN040006
Industry:
Real Estate
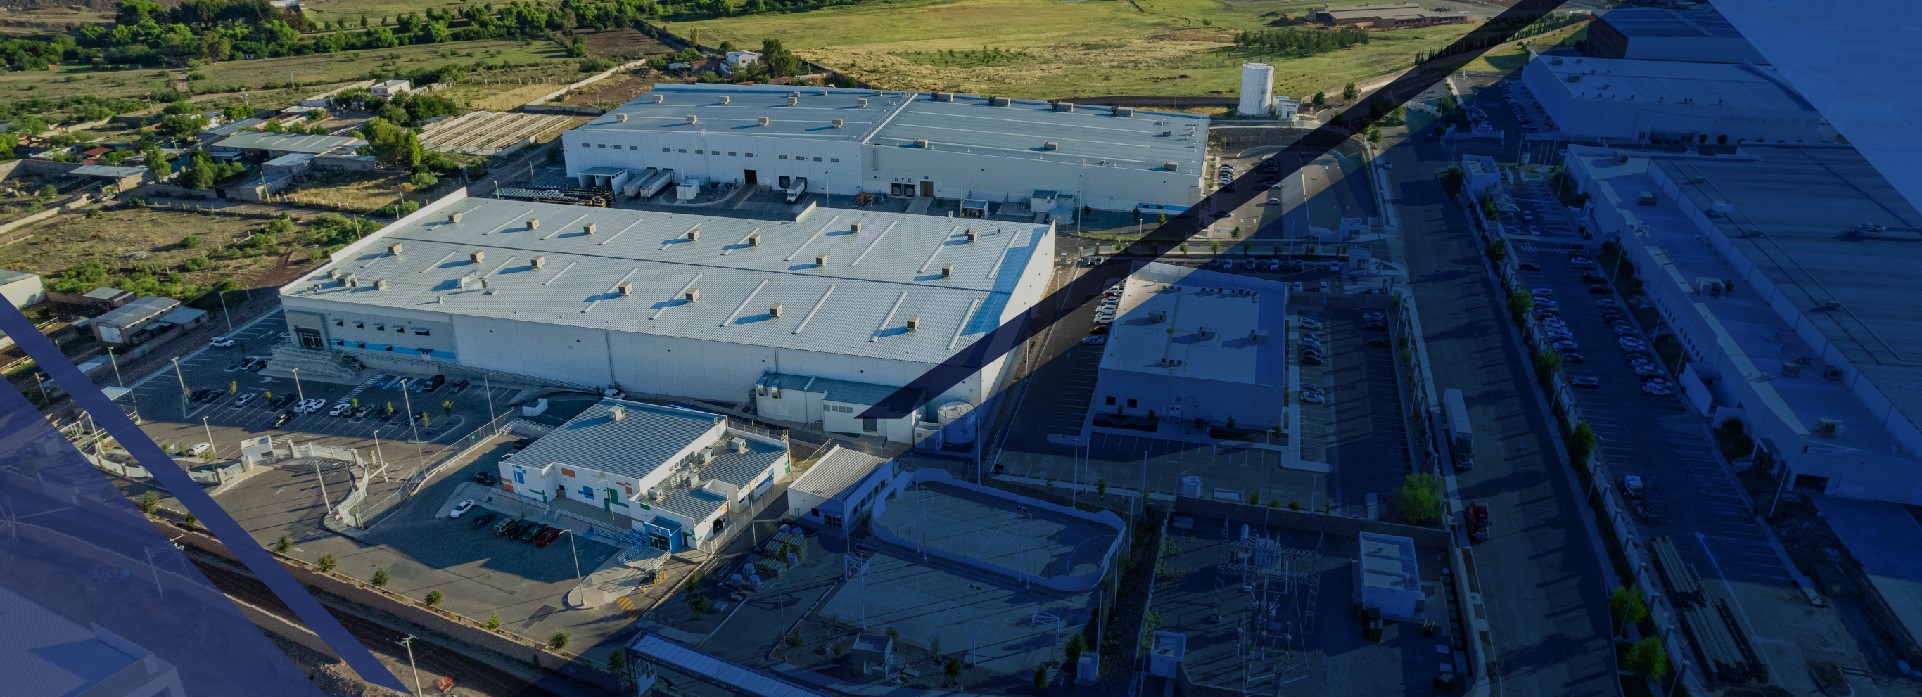
Fibra Nova is a Mexican Real Estate Investment Trust (FIBRA) engaged in acquiring, managing and developing a top-class real estate portfolio, currently comprised by 120 properties with a GLA of over 6,550,758 sqft distributed in 20 Mexican States.
Share Data
| Market | BIVA |
| Symbol | FNOVA17 |
| ISIN | MXCFFN040006 |
| Industry | Real Estate |
| Share Data | 30/05/2025 |
| Volume | 10,696 |
| Number of shares (Thousands) | 156,345 |
| Market Cap (Thousands) | 15,634,525 |
Figures as of 05/30/2025
Financial Highlights
| Balance Sheet (In thousands of pesos) | 3/31/2025 |
∆ % |
3/31/2024 |
12/31/2024 |
| Total assets | 23,720,622 | 35.8% | 16,519,205 | 23,342,288 |
| Total liabilities | 5,729,070 | 1.2% | 5,662,587 | 5,457,644 |
| Total equity | 17,991,552 | 49.5% | 10,856,618 | 17,884,644 |
| Income Statement (In thousands of pesos) | 3/31/2025 |
∆ % |
3/31/2024 |
12/31/2024 |
| Total revenue | 387,005 | 24.1% | 303,823 | 1,288,373 |
Total operating expenses |
10,004 | 24.1% | 7,854 | 33,001 |
| Net operating income (NOI) | 377,001 | 24.1% | 295,969 | 1,255,372 |
| Operating income | 413,750 | 27.8% | 312,704 | 1,202,660 |
| Income before taxes | 577,179 | -6.4% | 615,633 | 2,127,547 |
| Net income | 577,179 | -6.4% | 615,633 | 2,127,445 |
| EBITDA | 414,103 | 27.8% | 312,893 | 1,203,449 |
| Data Per Share | 3/31/2025 |
∆ % |
3/31/2024 |
12/31/2024 |
| Number of shares outstanding (thousands) | 593,647 | 25.2% | 460,742 | 593,606 |
| Share price (MXN) | 25.77 | -10.8% | 28.72 | 23.90 |
| Book value per share (MXN) | 30.31 | 25.0% | 23.56 | 30.13 |
| Ratios (%) | 3/31/2025 |
∆ % |
3/31/2024 |
12/31/2024 |
| Rent per square feet (USD/SQFT) | 8.38 | 9.9% | 7.59 | 8.22 |
| Average lease term remaining (years) | 6.7 | 0.0% | 6.7 | 6.9 |
| Occupancy rate (%) | 100 | 0.0% | 100 | 100 |
| EBITDA margin | 107.0 | 3.8% | 103.0 | 90.2 |
| AFFO margin | 85.86 | 5.6% | 81.19 | 90.48 |
| Dividend yield (%) | 8.60 | 12.9% | 7.55 | 8.56 |
| Debt / EBITDA ratio (%) | 4.25 | -21.9% | 5.29 | 4.31 |
| Loan to value ratio (%) | 23.40 | -34.0% | 33.00 | 22.23 |
| Cost of debt | 5.05 | -8.9% | 5.52 | 4.84 |
| Secured debt (%) | 100.00 | 33.2% | 71.51 | 100.00 |
| USD debt remaining term (years) | 2.8 | 3.6% | 2.7 | 2.8 |
Ratings
| Rating | Action |
Date |
Type |
| WD(mex) | Withdrawn |
29-Nov-2023 |
National Long Term Rating |
| WD(mex) | Withdrawn |
29-Nov-2023 |
National Long Term Rating |
Revenue by Business 2024
| Industrial | 64.8 % |
| Educative | 7.8 % |
| Retail | 2.9 % |
| Logistics | 3.4 % |
| Engineering centers | 5.8 % |
| Agroindustrial | 15.3 % |
Figures as of 05/30/2025
