INPEX CORPORATION
 Download PDF
| Market: Tokyo Stock Exchange | Symbol: 1605 | ISIN: JP3294460005 | Sector: Mining |
|
We are currently engaged in projects in more than 20 countries around the world for realizing a stable and efficient supply of oil and gas. We are the largest E&P company in terms of reserves and production volume in Japan, and we have grown to rank globally among the mid-tier oil and gas E&P companies. We are also establishing a gas supply chain with construction of Japanese gas infrastructure. By pressing forward with our growth strategy leading by large-scale LNG projects such as the Ichthys LNG Project in Australia, INPEX will pursue more growth as a global company. |
| Key figures (Millions of Yen) | Japan-GAAP |
IFRS |
||
| Fiscal year | 2022.12 |
2022.12 | 2023.12 | 2024.12 |
| Net sales/Revenue | 2,324,660 | 2,316,086 | 2,164,516 | 2,265,837 |
| Operating income/Operating profit | 1,246,408 | 1,503,667 | 1,114,189 | 1,271,789 |
| Ordinary income /Profit before tax | 1,441,995 | 1,445,382 | 1,253,384 | 1,298,811 |
| Net income /Profit | 461,069 | 498,452 | 321,708 | 427,344 |
Cash flows from operating activities |
751,284 | 782,274 | 788,130 | 654,737 |
| Cash flows from investing activities | -525,574 | -535,123 | -320,116 | -290,401 |
| Cash flows from financing activities | -241,928 | -246,597 | -487,272 | -349,937 |
| Per share (¥) | ||||
| Earnings per share (EPS) /Basic earnings per share | 337.37 | 364.73 | 248.55 | 345.31 |
| Net assets excluding minority interests /Equity attributable to owners of parent | 2,879.68 | 2,915.31 | 3,345.22 | 4,026.22 |
| Cash dividends | 62.00 | 62.00 | 74.00 | 86.00 |
| Payout ratio (%) | 18.4 | 17.0 | 29.8 | 24.9 |
| Total Payout Ratio(%) | 44.1 | 40.8 | 60.6 | 55.0 |
| End of the fiscal year | ||||
| Net assets /Total equity | 4,022,370 | 4,068,560 | 4,499,033 | 5,137,833 |
| Total assets | 6,259,853 | 6,448,414 | 6,739,476 | 7,380,863 |
| Other data | ||||
| Equity ratio(%)/Ratio of equity attributable to owners of parent to total assets(%) | 30.1 | 59.0 | 62.5 | 65.3 |
| Return on equity(ROE)(%) | 13.5 | 14.6 | 8.0 | 9.5 |
| Return On Invested Capital(ROIC)(%) | 9.4 | - | 8.4 | 8.4 |
| Net proved reserves(MM boe) | 3,738 | 3,738 | 3,572 | 3,343 |
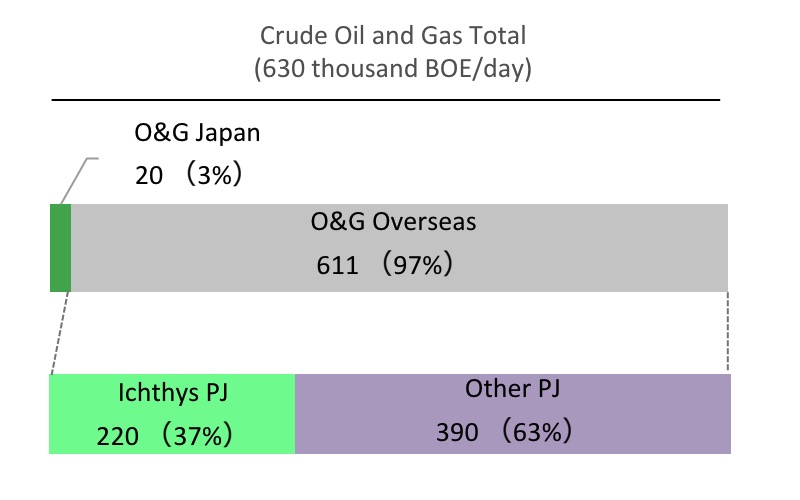
| Net production(Thousand boe/day) | 622 | 622 | 630 | 631 |
| Number of employees(end of the fiscal year) | 3,364 | 3,364 | 3,531 | 3,679 |
|
(IFRS) (IFRS) (IFRS) |
(IFRS) (IFRS) (IFRS) |
*The production volume under the production sharing contracts corresponds to the net
economic take of the INPEX Group
|

Supplied by ©