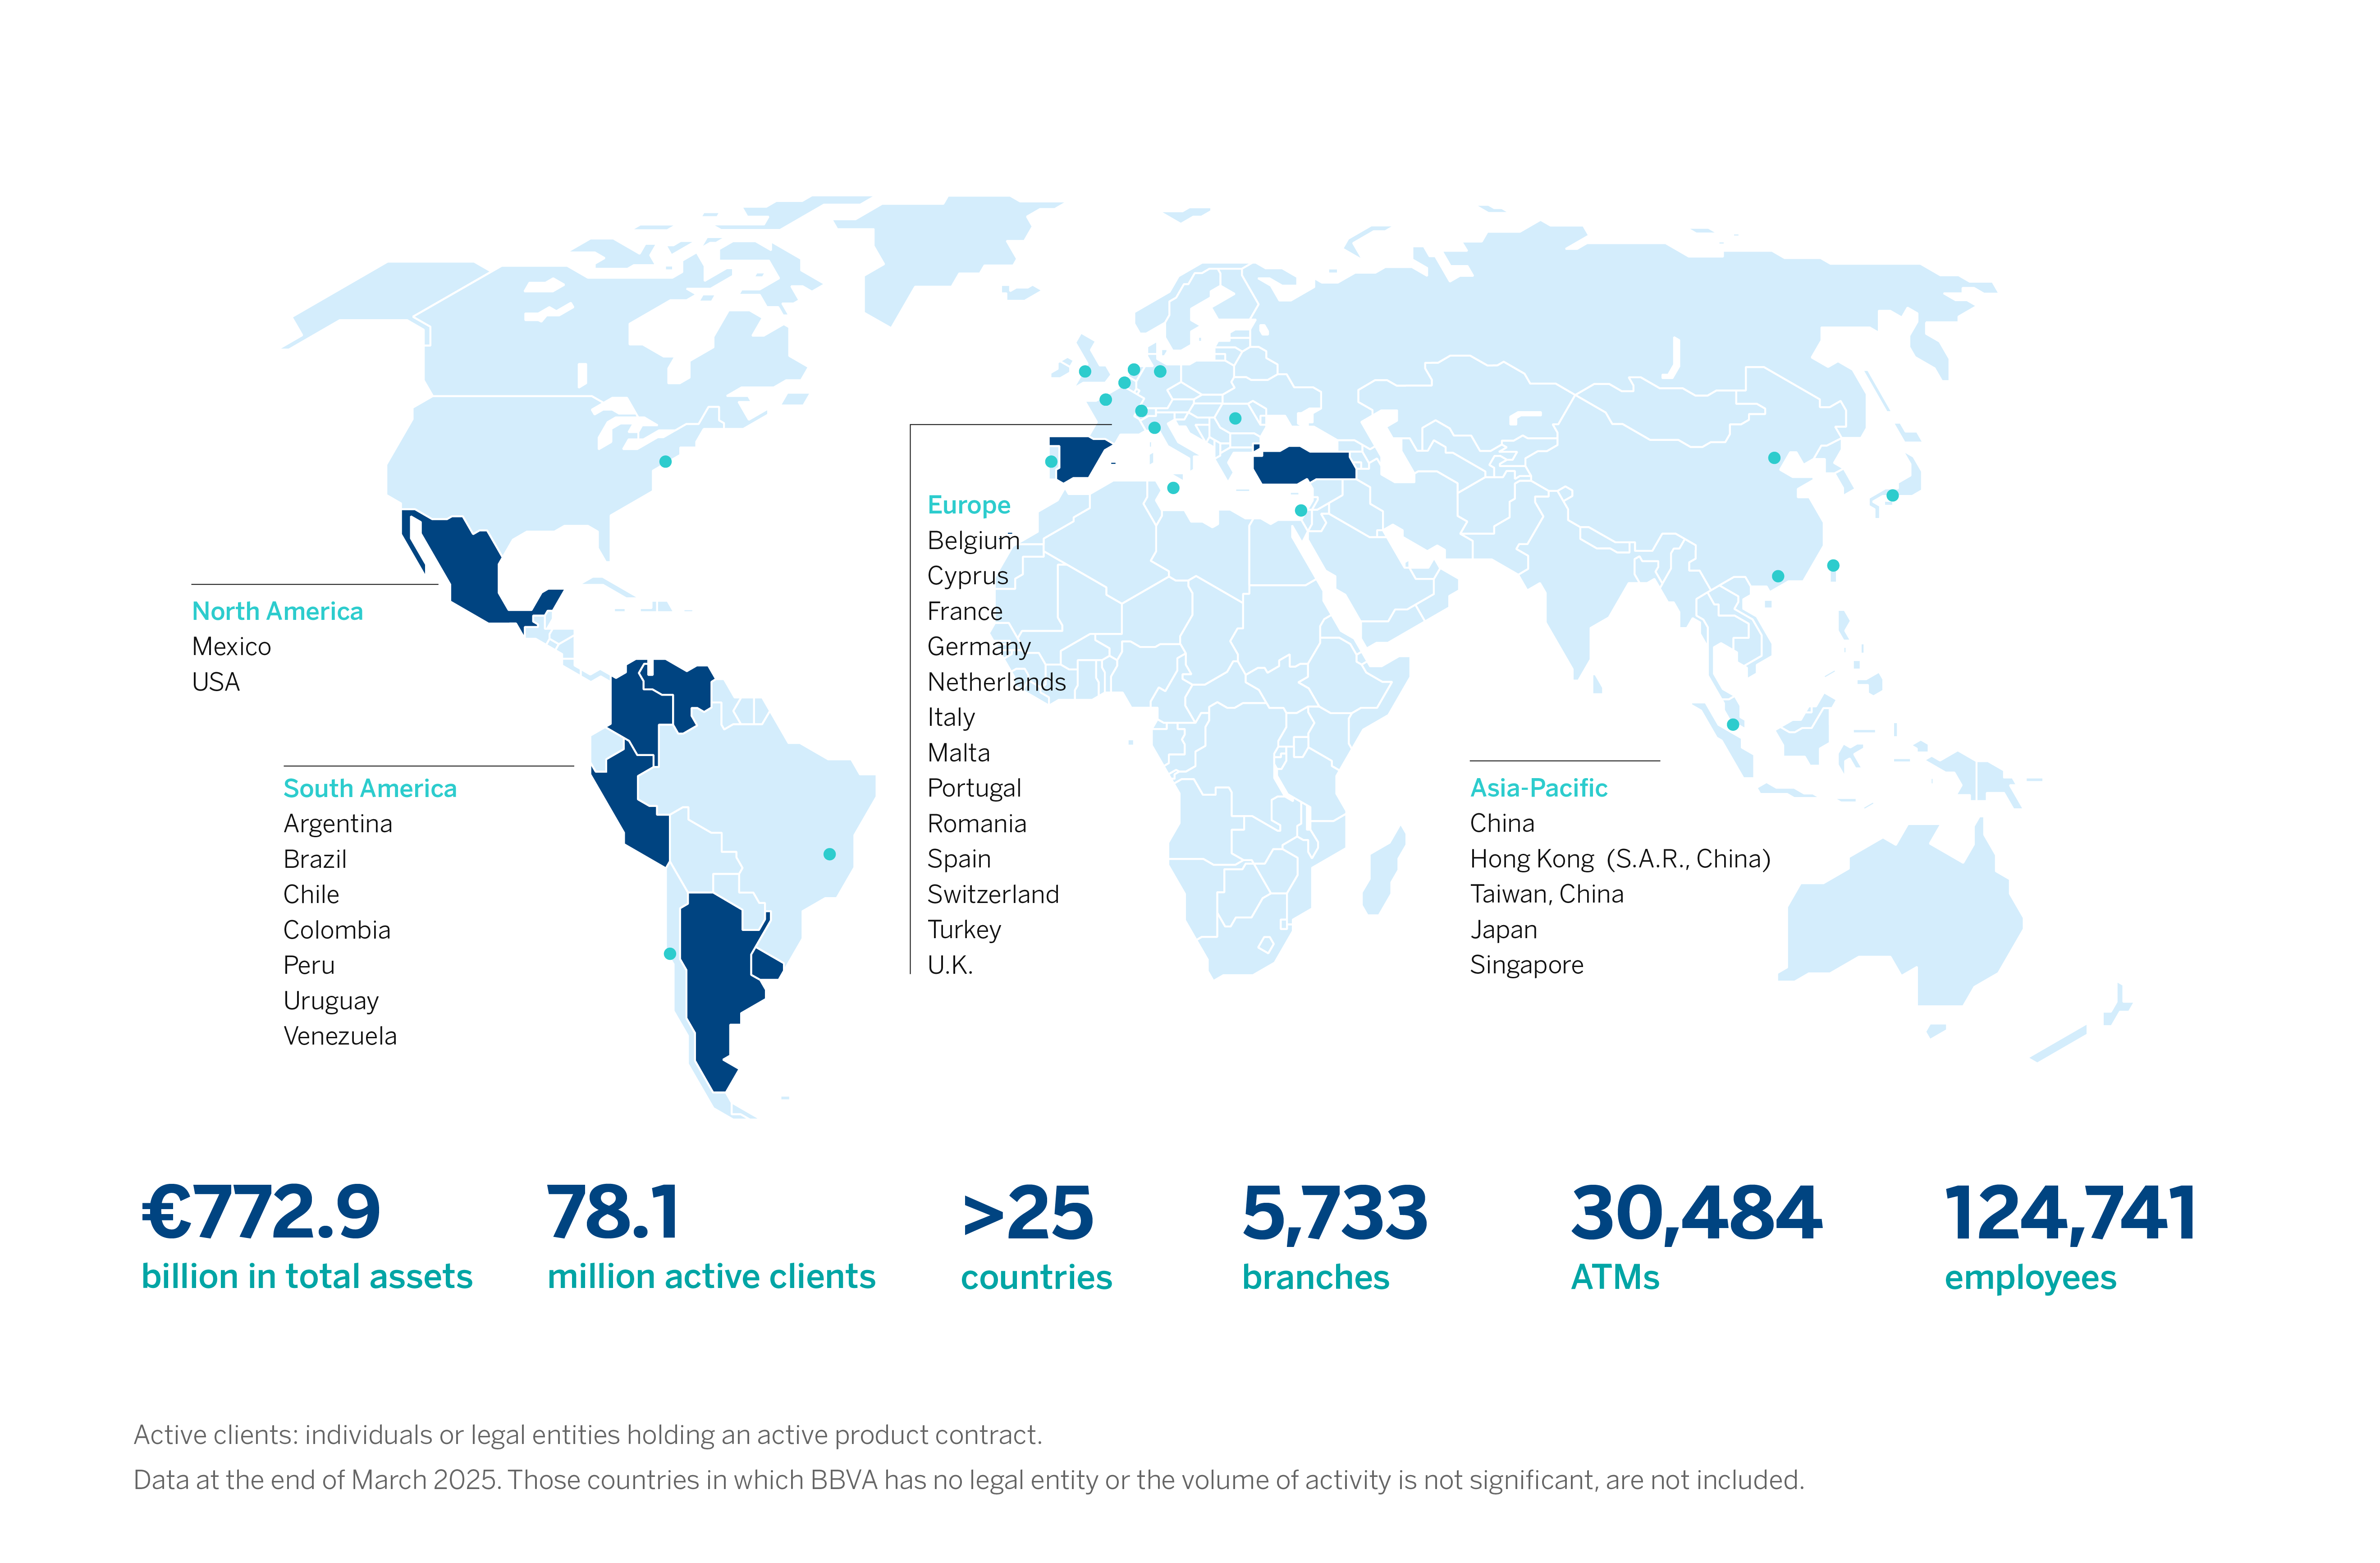
BBVA is a global financial services group founded in 1857. The bank is present in more than 25 countries, has a strong leadership position in the Spanish market, is the largest financial institution in Mexico and it has leading franchises in South America and Turkey.
BBVA contributes with its activity to the progress and welfare of all its stakeholders: shareholders, clients, employees, providers and society in general. In this regard, BBVA supports families, entrepreneurs and companies in their plans, and helps them to take advantage of the opportunities provided by innovation and technology. Likewise, BBVA offers its customers a unique value proposition, leveraged on technology and data, helping them improve their financial health with personalized information on financial decision-making.
| Market capitalization (million euros) |
72,300 |
|
Book value per share (euros) |
9.58⁽²⁾ |
| Balance Sheet (million euros) | 03-31-25 | ^% | 03-31-24 | 12-31-24 |
| Total assets | 772,863 | (3.6) | 801,690 | 772,402 |
| Loans and advances to customers (gross) | 428,673 | 7.0 | 400,457 | 424,087 |
| Deposits from customers | 455,708 | 4.3 | 436,763 | 447,646 |
| Total customer funds | 652,696 | 6.1 | 615,202 | 640,250 |
| Total equity | 59,264 | 6.2 | 55,778 | 60,014 |
| Income statement (million euros) | ||||
| Net interest income | 6,398 | (1.7) | 6,512 | 25,267 |
| Gross income | 9,324 | 13.5 | 8,218 | 35,481 |
| Operating income | 5,762 | 19.2 | 4,835 | 21,288 |
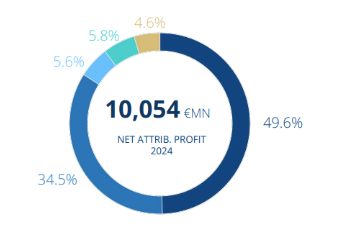
| Net attributable profit | 2,698 | 22.7 | 2,200 | 10,054 |
| Data per share | ||||
| Number of shares outstanding (million) | 5,763 | (1.3) | 5,838 | 5,763 |
| Number of shareholders(1) | 690,635 | (4.9) | 726,100 | 714,069 |
| Share price (euros) | 12.55 | 13.6 | 11.04 | 9.45 |
| Book value per share (euros)(2) | 9.58 | 5.9 | 9.04 | 9.67 |
| Ratios (%) | ||||
| ROE (net attributable profit or (loss)/average shareholders' funds +/- average accumulated other comprehensive income)(2) | 19.3 | 16.9 | 18.9 | |
| ROTE (net attributable profit or (loss)/average shareholders' funds excluding average intangible assets +/- average accumulated other comprehensive income)(2) | 20.2 | 17.7 | 19.7 | |
| ROA (profit (loss) for the period / average total assets - ATA)(2) | 1.48 | 1.19 | 1.36 | |
| RORWA (profit (loss) for the period / average risk-weighted assets - RWA)(2) | 2.90 | 2.50 | 2.76 | |
| Efficiency ratio(2) | 38.2 | 41.2 | 40.0 | |
| Cost of risk(2) | 1.30 | 1.39 | 1.43 | |
| NPL ratio(2) | 2.9 | 3.4 | 3.0 | |
| NPL coverage ratio(2) | 82 | 76 | 80 | |
| Capital adequacy ratios (%)(3) | ||||
| CET1 ratio | 13.09 | 12.82 | 12.88 | |
| Tier 1 ratio | 14.53 | 14.17 | 14.40 | |
| Total capital ratio | 17.55 | 16.66 | 16.90 | |
(1) See footnote to table of structural distribution of shareholders in the Capital and shareholders chapter of this report.
(2) For more information, see Alternative Performance Measures at this report.
(3) Preliminary data.
| Long term | Short term | Outlook | Last rating action | |
| Fitch | A- | F-2 | Positive | 02-11-2025 |
| Moody's | A3 | P-2 | Ratings Under Review (ON WATCH for Possible Upgrade) | 03-17-2025 |
| Standard&Poor´s | A | A-1 | Stable | 03-27-2025 |
| DBRS | A (high) | R-1 (middle) | Stable | 02-24-2025 |
Headquarters Ciudad BBVA. Calle Azul,4
28050 Madrid, Spain
New York Office Two Manhattan West, 375 9th Avenue,
9th Floor, New York, NY 10001
Shareholders accionistas@bbva.com /Tel: +34 912 249 821
Investors bbvainvestorrelations@bbva.com /Tel:+34 915374524
More information at:
http://shareholdersandinvestors.bbva.com