FACTSHEET
VW Pref. Share ISIN: DE0007664039
VW Ordin. Share ISIN: DE0007664005
Primary Exchange: Frankfurt
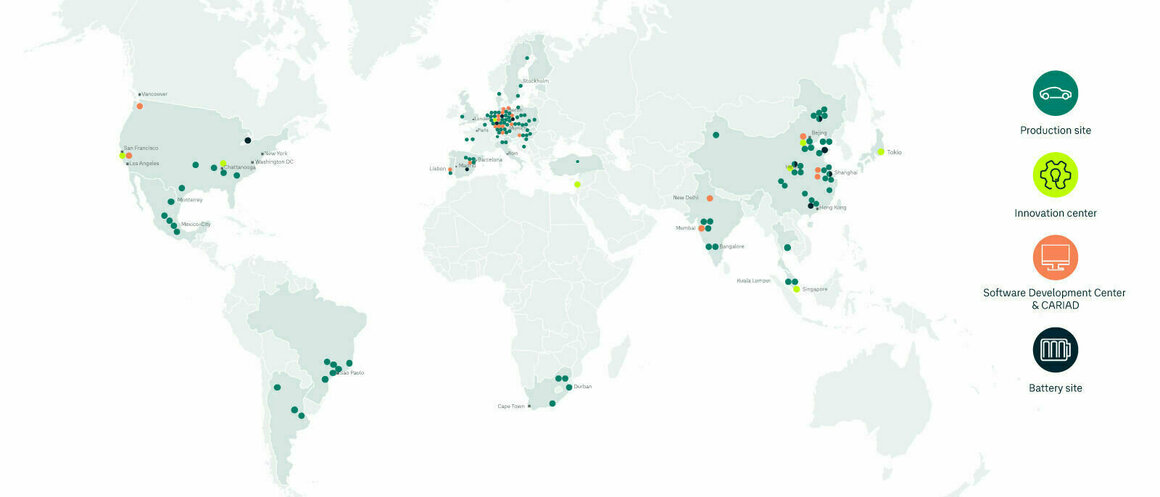
The Volkswagen Group is one of the world's leading car makers, headquartered in Wolfsburg, Germany. It operates globally, with 114 production facilities in 17 European countries and 10 countries in the Americas, Asia and Africa. The Group employs around 684,000 employees worldwide. Its vehicles are sold in over 150 countries.
With an unrivalled portfolio of strong global brands, leading technologies at scale, innovative ideas to tap into future profit pools and an entrepreneurial leadership team, the Volkswagen Group is committed to shaping the future of mobility through investments in electric and autonomous driving vehicles, digitalization and sustainability.
In 2024, the total number of vehicles delivered to customers by the Group globally was 9.0 million (2023: 9.2 million).
FINANCIAL YEAR 2024
324.7 billion EUR Group Sales Revenue in 2024 |
19.1 billion EUR Group Operating Result in 2024 |
5.9 % Group Operating Result Margin in 2024 |
5.0 billion EUR Net Cash Flow Automotive in 2024 |
36.1 billion EUR Net Liquidity Automotive in 2024 |
KEY FIGURES
| 2020 | 2021 | 20221 | 20232 | 2024 | |
| Volume Data (thousands) | |||||
| Deliveries to customers (units) | 9,305 | 8,882 | 8,263 | 9,240 | 9,027 |
| Vehicle sales (units) | 9,157 | 8,576 | 8,481 | 9,362 | 9,037 |
| Production (units) | 8,900 | 8,283 | 8,717 | 9,309 | 8,954 |
| Employees (yearly average) | 668 | 668 | 669 | 676 | 683 |
| Financial Data (in € million) | |||||
| Income Statement | |||||
| Sales revenue | 222,884 | 250,200 | 279,050 | 322,284 | 324,656 |
| Gross profit | 38,947 | 47,241 | 52,184 | 60,985 | 59,472 |
| Operating result | 9,675 | 19,275 | 22,109 | 22,528 | 19,060 |
| Earnings before tax | 11,667 | 20,126 | 22,070 | 23,099 | 16,806 |
| Earnings after tax | 8,824 | 15,428 | 15,852 | 17,861 | 12,394 |
| Balance Sheet (at December 31) | |||||
| Noncurrent assets | 302,170 | 328,261 | 339,853 | 361,005 | 387,674 |
| Current assets | 194,944 | 200,347 | 224,159 | 239,644 | 245,231 |
| Total assets | 497,114 | 528,609 | 564,013 | 600,649 | 632,905 |
| Equity | 128,783 | 146,154 | 178,328 | 189,186 | 196,731 |
| of which: noncontrolling interests | 1,734 | 1,705 | 12,952 | 14,218 | 14,437 |
| Noncurrent liabilities | 202,921 | 218,062 | 202,961 | 205,427 | 219,134 |
| Current liabilities | 165,410 | 164,393 | 182,723 | 206,036 | 217,039 |
| Cash flows | |||||
| Cash flows from operating activities | 24,901 | 38,633 | 28,496 | 19,356 | 17,151 |
| Cash flows from investing activities attributable to operating activities | 18,372 | 24,181 | 25,454 | 28,031 | 28,853 |
| Cash flows from financing activities | 7,637 | -7,754 | 4,225 | 16,008 | 11,140 |
| Key Figures (%) | |||||
| EPS (Pref) (€) | 16.66 | 29.65 | 29.72 | 31.85 | 21.42 |
| Gross margin | 17.5 | 18.9 | 18.7 | 18.9 | 18.3 |
| Operating return on sales | 4.3 | 7.7 | 7.9 | 7.0 | 5.9 |
| Return on sales before tax | 5.2 | 8.0 | 7.9 | 7.2 | 5.2 |
| Return on sales after tax | 4.0 | 6.2 | 5.7 | 5.5 | 3.8 |
| Equity ratio | 25.9 | 27.6 | 31.6 | 31.5 | 31.1 |
1. The year 2022 was adjusted due to the new version of IFRS 17.
2. Prior-year figures adjusted.
INVESTMENT STORY

- Solid revenue development with leading market position in Austria
- Sustainable profitability due to an efficient cost structure

- Predictable development of dividends based on profitability and generated cash flow
- Annual dividend distribution of at least 75% of the Group net profit planned

- Prudent and realistic guidance with clearly defined objectives
- Clear commitment to achieve communicated targets

- Group-wide reduction in fossil energy sources
- Massive reduction in carbon emissions in Austria by 2030
SHARE PERFORMANCE